> ## Documentation Index
> Fetch the complete documentation index at: https://docs-staging-actions-triggers-prototype.mintlify.site/llms.txt
> Use this file to discover all available pages before exploring further.
> Describes how to use the Auth0 App for Sumo Logic to create a Sumo Logic Auth0 dashboard to visualize your tenant traffic.
# Use Auth0 App for Sumo Logic
You can use the **Auth0 App for Sumo Logic** to visualize the data from your Auth0 tenant in a Sumo Logic dashboard. The dashboard allows you to monitor the health of the login traffic for a tenant. The app allows you to use recommended aggregations from Auth0, or to use them as a starting point to create your own custom visualizations.
## Prerequisite
[Set up log streaming to Sumo Logic](https://marketplace.auth0.com/integrations/sumo-logic-log-streaming).
## Install the Auth0 App for Sumo Logic
1. Log in to [Sumo Logic](https://www.sumologic.com).
2. From the **App Catalog**, search for and select the Auth0 app.
3. To install the app, complete the following fields:
| Field | Description |
| --------------- | ----------------------------------------------------------------------------------------------------------------------------------------------------------------------------------------------------------------------- |
| **App Name** | Retain the existing name or enter a name of your choice. |
| **Data Source** | Choose **Source Category** and select a category from the list, or choose **Enter a Custom Data Filter** and enter a custom source category beginning with an underscore. For example: ***sourceCategory=MyCategory***. |
| **Advanced** | Select the **Location in Library** (default is Personal folder) or click **New Folder** to add a new folder. |
4. Select **Add to Library**.
Once an app is installed, it appears in your **Personal** folder or the folder you selected. From here, you can share it with your organization.
Panels will fill automatically over time. Panels fill slowly fills with data matching the time range query and received since the panel was created.
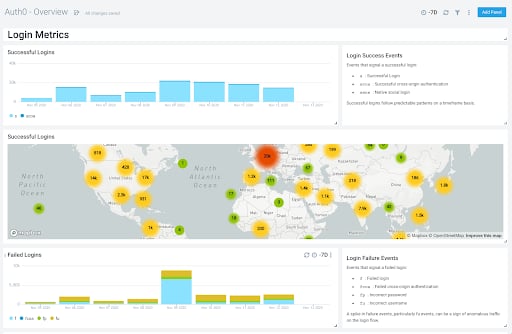 The dashboard is broken down into the following categories or panels:
* **Login Metrics**: See the count of actions such as successful logins and failed logins.
* **Account Creation Metrics**: See the breakdowns of account creation by country, platform, IP, and other demographics.
* **Security Metrics**: See anomaly detection events over time to detect and attack.
## Dashboard filters
Each dashboard has a set of filters that you can apply to the entire dashboard. Click the funnel icon in the top dashboard menu bar to display a scrollable list of filters that are applied across the entire dashboard.
Each panel also has a set of filters that are applied to the results for that panel only. Click the funnel icon in the top panel menu bar to display a list of panel-specific filters.
## Customize dashboard
You can customize your Sumo Logic Auth0 security dashboard to add custom data widgets.
1. Navigate to your Auth0 security dashboard and select **add panel** in the top right corner.
2. Select a panel type by clicking the icon. See [Sumo Logic help](https://help.sumologic.com/Visualizations-and-Alerts/Dashboard_\(New\)/Panels) for details.
3. Enter logs query, metrics query, or multiple queries from the drop-down.
4. To change the chart type, see [Sumo Logic help](https://help.sumologic.com/Visualizations-and-Alerts/Dashboard_\(New\)/Panels/01Modify_a_Chart) for the available options.
5. Click **Add to Dashboard** on the top right to add the panel to your dashboard.
## Learn more
* [Log Type Codes](/docs/deploy-monitor/logs/log-event-type-codes)
* [View Attack Protection Log Events](/docs/secure/attack-protection/view-attack-protection-events)
The dashboard is broken down into the following categories or panels:
* **Login Metrics**: See the count of actions such as successful logins and failed logins.
* **Account Creation Metrics**: See the breakdowns of account creation by country, platform, IP, and other demographics.
* **Security Metrics**: See anomaly detection events over time to detect and attack.
## Dashboard filters
Each dashboard has a set of filters that you can apply to the entire dashboard. Click the funnel icon in the top dashboard menu bar to display a scrollable list of filters that are applied across the entire dashboard.
Each panel also has a set of filters that are applied to the results for that panel only. Click the funnel icon in the top panel menu bar to display a list of panel-specific filters.
## Customize dashboard
You can customize your Sumo Logic Auth0 security dashboard to add custom data widgets.
1. Navigate to your Auth0 security dashboard and select **add panel** in the top right corner.
2. Select a panel type by clicking the icon. See [Sumo Logic help](https://help.sumologic.com/Visualizations-and-Alerts/Dashboard_\(New\)/Panels) for details.
3. Enter logs query, metrics query, or multiple queries from the drop-down.
4. To change the chart type, see [Sumo Logic help](https://help.sumologic.com/Visualizations-and-Alerts/Dashboard_\(New\)/Panels/01Modify_a_Chart) for the available options.
5. Click **Add to Dashboard** on the top right to add the panel to your dashboard.
## Learn more
* [Log Type Codes](/docs/deploy-monitor/logs/log-event-type-codes)
* [View Attack Protection Log Events](/docs/secure/attack-protection/view-attack-protection-events)